From install to customer-visible updates
in under 60 seconds.
Set it up inside Azure DevOps, publish your status page, and automate incident updates from the same workflows your team already uses.
Install from Visual Studio Marketplace
Search for “Status Portal” in the Visual Studio Marketplace and install it to your Azure DevOps organisation. No servers to provision, no extra vendor account, and no infrastructure to manage.
marketplace.visualstudio.com →Configure your components
The Status Portal hub appears directly in your Azure DevOps left navigation. Define the services customers actually care about — APIs, build systems, deployment environments, and regions — and group them into a clean public view. Each component can be updated manually or via pipeline triggers.
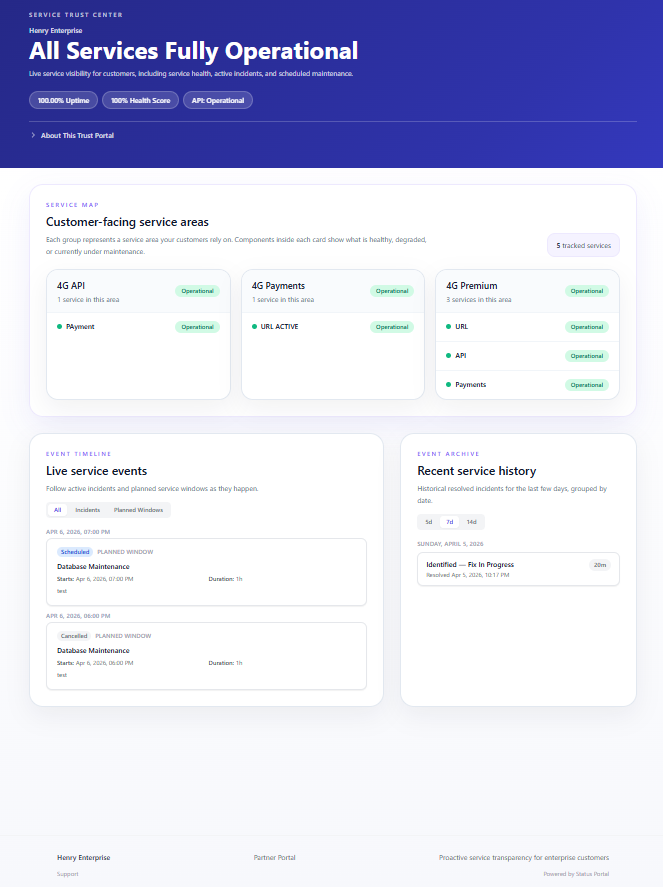
What your customers see
Your status page is live immediately. Point a CNAME DNS record to serve it from status.yourcompany.com. Customers can subscribe for alerts, follow incident progress, or check service health before they open a support ticket.
Automate with ADO pipelines
Add a single task to your Azure Pipelines YAML and let Status Portal create or update incidents when deployments fail. Your public page and connected alerts stay in sync automatically.
- task: AzureCLI@2
  displayName: 'Update status page on failure'
  condition: failed()
  inputs:
    scriptType: bash
    scriptLocation: inlineScript
    inlineScript: |
      curl -X POST https://api.status.baytekdev.com/v1/incidents \
        -H "Authorization: Bearer $(STATUS_PORTAL_TOKEN)" \
        -H "Content-Type: application/json" \
        -d '{
          "component": "Build Pipeline",
          "status": "degraded",
          "title": "Pipeline failure detected",
          "body": "Automated incident from pipeline run $(Build.BuildNumber)"
}'{
"event": "incident.created",
"id": "inc_01HX4K9J3M",
"component": "API Gateway",
"status": "degraded",
"title": "Elevated latency in US East",
"created_at": "2026-04-03T14:22:00Z",
"public_url": "https://status.yourcompany.com",
"organisation": "contoso"
}The incident lifecycle
Every incident follows a structured lifecycle. Each status transition sends notifications to subscribers and updates the public status page in real time.
Architecture Overview